

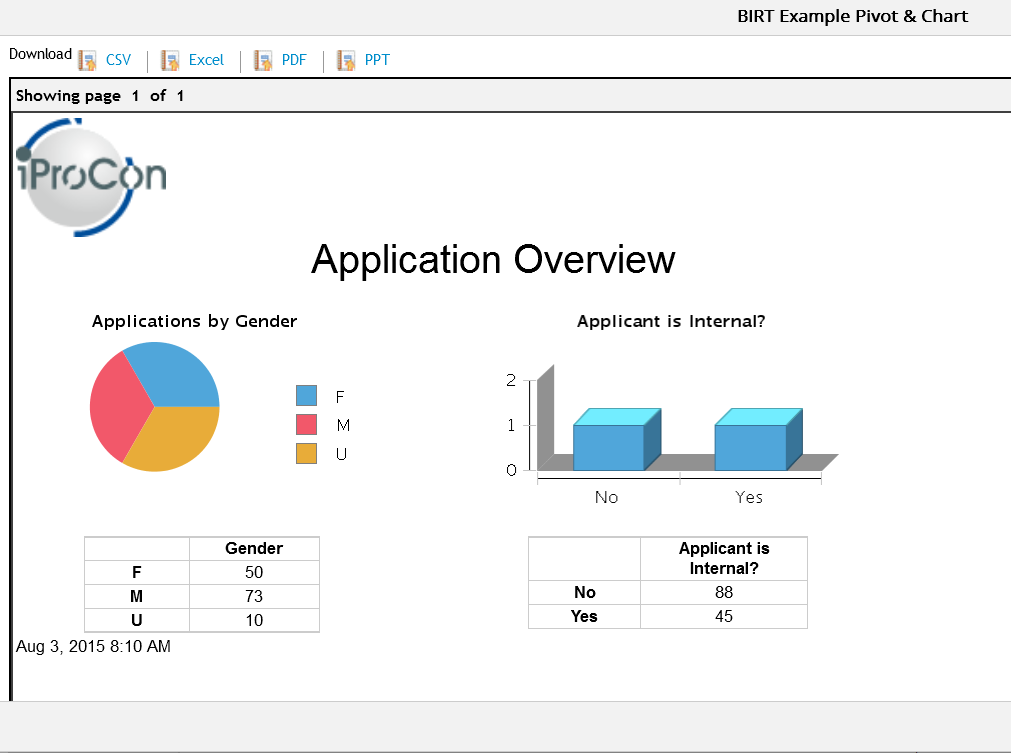
BIRT (Business Intelligence and Reporting Tool) is an open source project and add-on for Eclipse. In SuccessFactors, you can use BIRT to amend the presentation of your ad hoc reports. It also gives you the chance to show your data in pivot tables. Data is exported to BIRT to build the report. Afterwards you upload a template and you can present your results in SuccessFactors everytime you run the report. In this article I’ll show you how the templates look and describe using BIRT in greater detail.
 BIRT in SuccessFactors
General Things for BIRT in SuccessFactors
In the past, BIRT was mostly used in the Learning Module (originally, the software behind the Learning Module was „Plateau“, and was acquired by SuccessFactors in 2011) but has now found its way to all other modules of SuccessFactors. As mentioned BIRT report designer is a free open source tool and available at: http://www.birt-exchange.com. But the integration feature for SuccessFactors may come with a charge, so You need to contact your SuccessFactors account manager to talk about a license.
With BIRT in SuccessFactors, it’s much easier to deliver insights in your data. Whether presenting to your line manager or to your board of directors, you can quickly highlight important trends, identify progress against key metrics and make your information accessible to all audiences. With the ad hoc report feature to share a report, you automatically get the possibility to drive action by sharing critical metrics across the organization and to empower your team.
To clarify: the BIRT Templates enhance your ad hoc report. That means the template is pulling the ad hoc report data into the SuccessFactors Report Builder engine to transform your data into a visualised report. There is no extra button, no extra interface or hidden secret: it will just show instead of the old ad hoc report.
For that feature all you need to do is to subscribe the Visual Publisher service from SuccessFactors and it will allow you to upload report templates built using open source BIRT report designer. Here are some ideas of what you could do with BIRT in ad hoc reporting:
- Lists – Group related data together and easily add totals, averages and other summaries.
- Charts – Make numeric data easier to understand with charts including pie, line, bar and many more.
- Cross tabs – Show data in two dimensions such as quarterly goal attainment by division or annual compensation increases per department.
- Letters and Documents – Create form letters and other documents that can include text, formatting, lists, charts and more.
- Compound Reports – Or combine all of these capabilities into a single document with your corporate branding.
Note: Visual Publisher still needs to be activated in Provisioning. Moreover the latest BIRT Version is not supported by SuccessFactors (at time of writing). The official version supported by SuccessFactors is BIRT 3.6.0.
Functionality & Features of BIRT Reports in SuccessFactors

BIRT is a great BI Tool I worked with several years ago and I am happy to see it find its way to SuccessFactors. For some techies, it will feel comfortable, as BIRT is just an add-on for the famous Eclipse development environment. The Look & Feel is sometimes similar to the Online Report Designer (ORD) in SuccessFactors. But you will get better option to customise your report layout in BIRT. To get a better picture of BIRT – where and how you can build something –
I’ve added a picture, „BIRT Overview“, showing a working screen with Palette, Outline, Work Area and Property Setting Area…
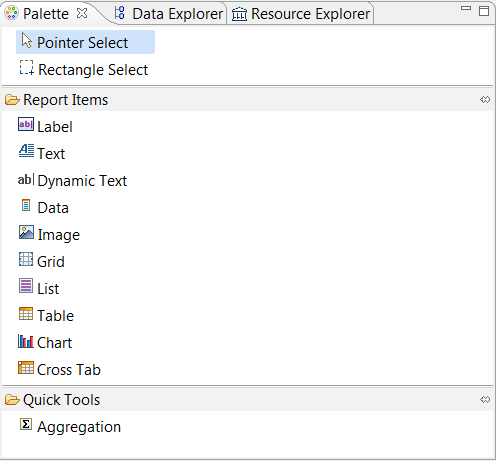
As in YouCalc, you get your data source from the ad hoc reports in your instance. You cannot write your own SQL Queries or drag and drop different fields together to pull data from the Instance, but you can use your data multiple times in your report to build a table or chart with the same data, for example. To build reports, you have a similar interface to Microsoft Word, into which you can drag & drop objects. See picture „BIRT Objects“ for the list of the BIRT objects you can use in your reports.
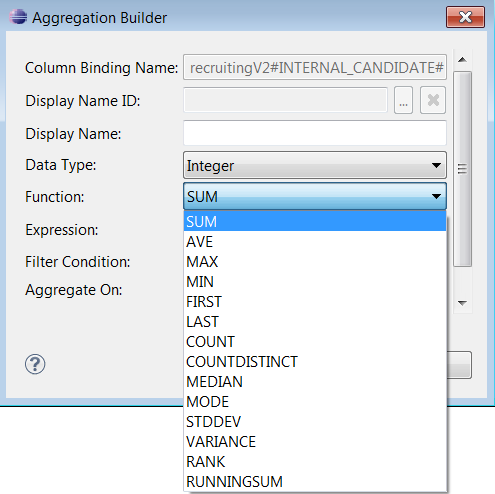
I compare BIRT and YouCalc so extensively in this article, because both tools are 3rd party tools, which are not included in SuccessFactors directly like the Online Report Designer. Next, I would like to point out the functions in BIRT; BIRT has all the basic functions you would expect (e.g. filter, sort, sum and so on) to calculate or manipulate your report data, but you will not find as many logical or special functions as in YouCalc Dashboard Builder. The reason is easy to explain: with the YouCalc Builder you normally build much more interactive and complex reports.
Something which is slighty better done in BIRT compared to YouCalc is the handling of Object Properties and Preview Mode. It is easy to change colors, size, alignment and much more in BIRT because the basic components are likely to change, as in Microsoft Word, and very intuitive if you are familiar with HTML and CSS (indeed, you can use CSS Styles in BIRT to define your objects). Still, you have to be careful, because the Preview could have a different outcome to the result in your instance.

Pros & Cons of BIRT Reports in SuccessFactors
BIRT is a great BI Tool to use. It has a lot of advantages and is a huge enhancement compared to the basic ad hoc reports in SuccessFactors, but you will reach its limits at some points. In some cases it would make sense to use another reporting solution, such as another one mentioned in my series of reporting articles (past and future). BIRT is nearly as strong as the YouCalc Dashboard Builder, but still limited to one ad hoc report as a source of data. On the other hand, you have a great opportunity to get your ad hoc data visualised quickly and nicely (though how nicely still depends on your requirements), without a lot of hassle. If you wish to review the question, we already discussed the topics of flexibility and level of visualisation in the first article of this reporting series in SuccessFactors.
Advantages
+ stable software with intuitive UI
+ huge enhancement compared to basic ad hoc report layout
+ wide range of visualisation option (Standard, HTML + CSS)
+ using same data source multiply times in the same Report
Disadvantages
– can use just one ad hoc report at the time
– limits in flexibility for dynamic or indepth interactions
– external tool (for building the report – users see it in within SuccessFactors), which requires training and enablement through Provisioning
This Article is part of a series in “HR Reporting and Analytics in SuccessFactors”
- HR Reporting and Analytics in SuccessFactors – Part 1
- Standard & Ad Hoc Reporting in SuccessFactors – Part 2
- Visual Reporting with Dashboard 2.0 Reports in SuccessFactors – Part 3
- Visual Reporting with BIRT Templates in SuccessFactors – Part 4
- Advanced Reporting & Online Report Designer in SuccessFactors – Part 5
- Workforce Analytics Module in SuccessFatorcs – Part 6
SuccessFactors Training and Demo
You still don’t have enough and want to learn more? We offer various SuccessFactor Reporting Trainings. If you have bespoke training needs, the packages can be adjusted accordingly. Just ask – we are happy to help. Same counts for a SuccessFactors Demo. Accordingly to your requirements we prepare a SF Demo to show how things work and what options you have.


Hello
Has anyone used BIRT for Succession module reporting purpose. If yes, please let me know if it works with normal dataset from an ad hoc reporting?
Thanks
Chethan
Hey Chethan,
it works with any ad-hoc Report. No matter which module (except EC. Therefore you got ODS)
I am new to the whole ORD and ad hoc world, with actually no training in ad hoc at all. What can I do or where can you recommend I go to for more training in ORD and ad hoc?
The Standard trainings in the learning hub contain some training in adhoc, e.g. THR80.
Most ORD training is in the WFA course.
We also offer training packages as well as bespoke in-house training, which may be a bit more effective as you have a dedicated instructor working with you on your examples:
https://iprocon.de/training-in-successfactors-sap-hcm-and-concur/successfactors-reporting-training/?lang=en
…with the added benefit that you’ll probably be trained by the author of this legendary blog series ;-)
Hey Chris,
we provide a training if you want to: Check this Site
Also SAP Education Center Helps. If you got an SF Intance it also helps to play a bit.
Kind Regards,
Chris
Hi,
Thank you so much for the great article.
As ORD is shipped along with SF instance, we can use ORD instead of BIRT to enhance the Adhoc report right ?
Could you please guide me with a scenario why BIRT is needed when SF has ORD.
Thanks again for all the information.
Regards.
Hey Venky, BIRT still have nicer Charts and better style options. You also can’t Sub Total for rows in ORD… In my opinion BIRT is still a bit nicer. The big point for ORD is the cross domain report option. As for all Reporting Tools it depends what you want to build. In some cases BIRT is still a better option.
I’ve tried to use BIRT with a multi dataset report the last week. Unfortunately it didn’t work.
Do I need to tell the report design which DataSet (in BIRT) is mapped to which DataSet (in the Adhoc-Report)?
Please check with Successfactors on using more this one query in ad hoc reporting to create multiple datasets in BIRT. The custom reporting team has used such a solution for a few customers.
The custom reporting team would use BIRT against multi data set ad hoc reports to create robust multi query based BIRT reports
Yes, you can use a multi-domain adhoc report, but you can just us one adhoc report in BIRT. You can do multiple datasets in BIRT. Seperate data in multiple data sets and work with them is totally fine, but the source will be just one adhoc report.
In YouCalc for example you can import more than one ad hoc report. Doesn’t matter if single, multi or cross domain adhoc report.